A redesign of the online offer flow, aimed at giving sellers a price they believe and cutting the phone calls needed to close a deal.
Role
Product Designer
Team
2 product designers, 1 PM, 2 researchers
Timeline
Feb to Aug 2026
The problem
Cash for Cars is one of three inventory channels at a large online vehicle auction platform. About 275,000 people reached the site each month, and only around one in ten sold a car.
Users visiting275,128
Users selling28,836
Earlier research pointed to two causes. Closing one deal took three to six calls, and the pricing model struggled with expensive vehicles. Five usability interviews then showed where sellers lost confidence: the final offer left out what they needed to know, and yes/no questions gave them no way to describe their car.
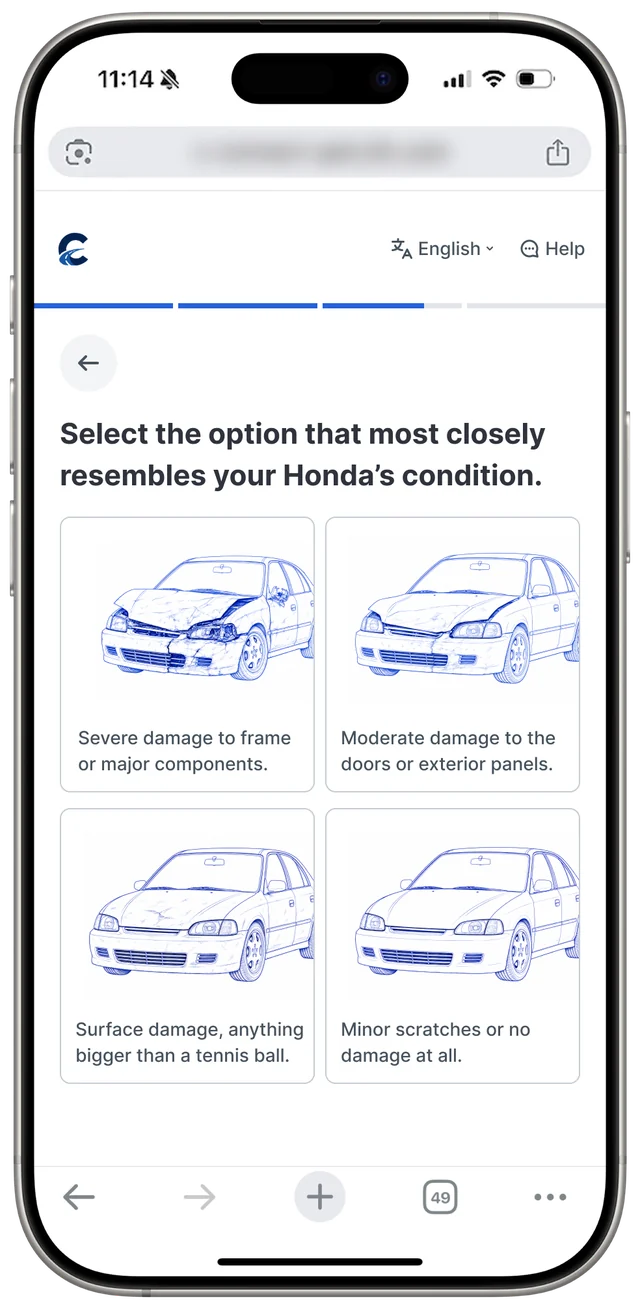
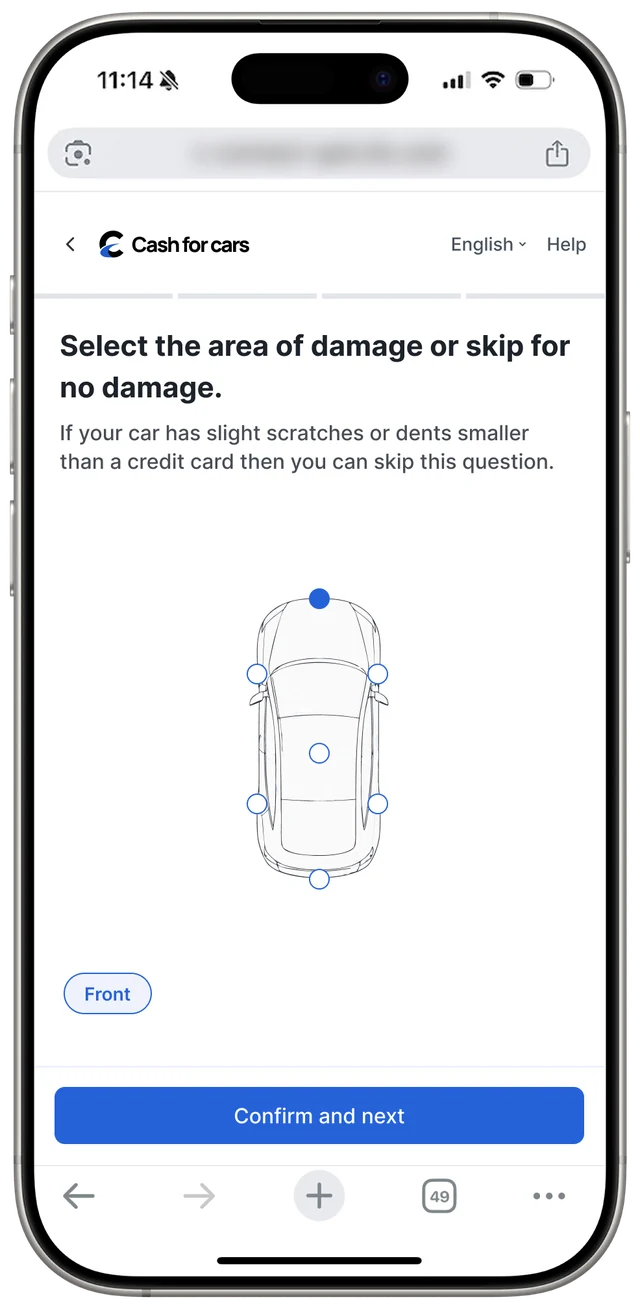
Before: a yes or no damage question, then a car silhouette to tap. Nothing captured how bad the damage was.
Working within the pricing model
Rebuilding the model would have taken heavy engineering effort. The designers worked through its data with the PM and data analyst and used Claude to translate it for the team. Very granular inputs turned out to make prices less accurate, so the team set out to improve the quality of each answer while keeping the question count in check.
The Instaquote 3.0 requirements document set the constraints, including a mobile-first priority. Owner names are blurred.
Rethinking the damage question
Damage extent mattered most to the model and confused sellers most. Three directions were tested against both needs.
Exploration 1
Picture references
Photos of damage looked busy, left severity unclear and risked pushing people to understate their car's condition.
Exploration 2
Severity per area
This gave the most control, but the model only reads the highest severity, so the extra steps added nothing.
Chosen
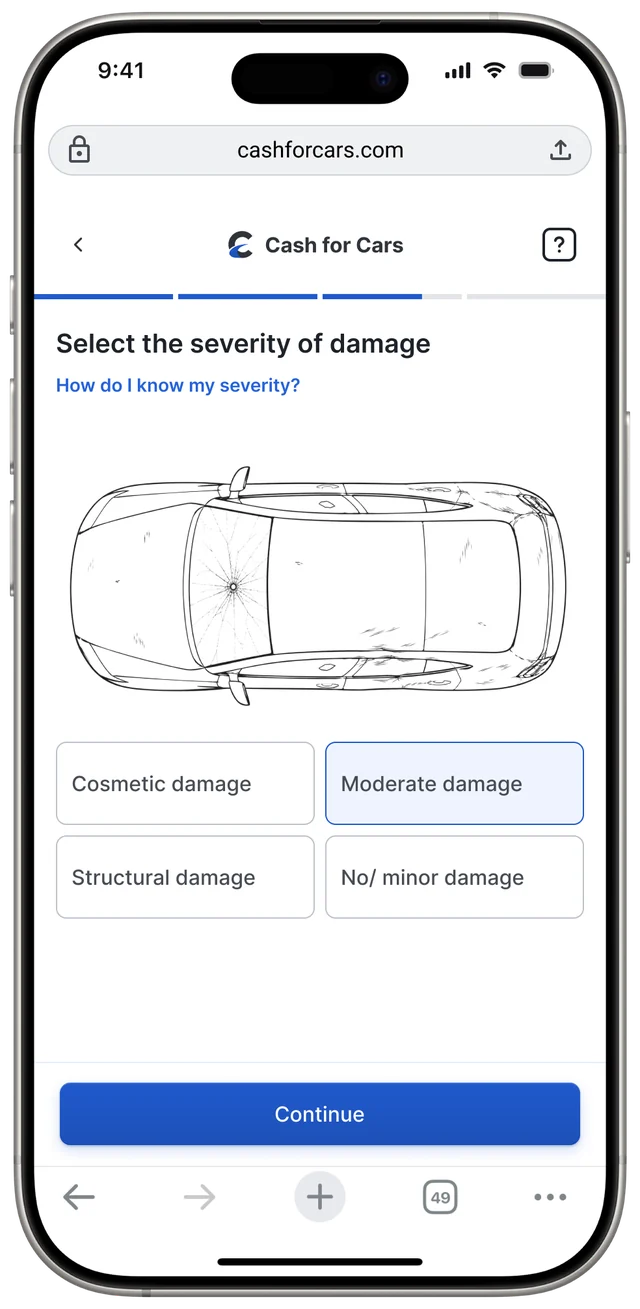
Severity, then area
Sellers pick one severity, then mark the affected parts. Cosmetic, moderate and structural proved clearer than minor to severe.
Photos as an optional route
Image analysis was the most accurate read of a car's condition, but it only ran at the end for verification. The business feared a mandatory photo step would cause drop-offs. The team made it an optional path ahead of the manual questions.
BeforeExtent of damage→Area of damage→Final offer→Image upload
AfterOptional image upload→Final offer
Or skipExtent of damage→Area of damage→Final offer
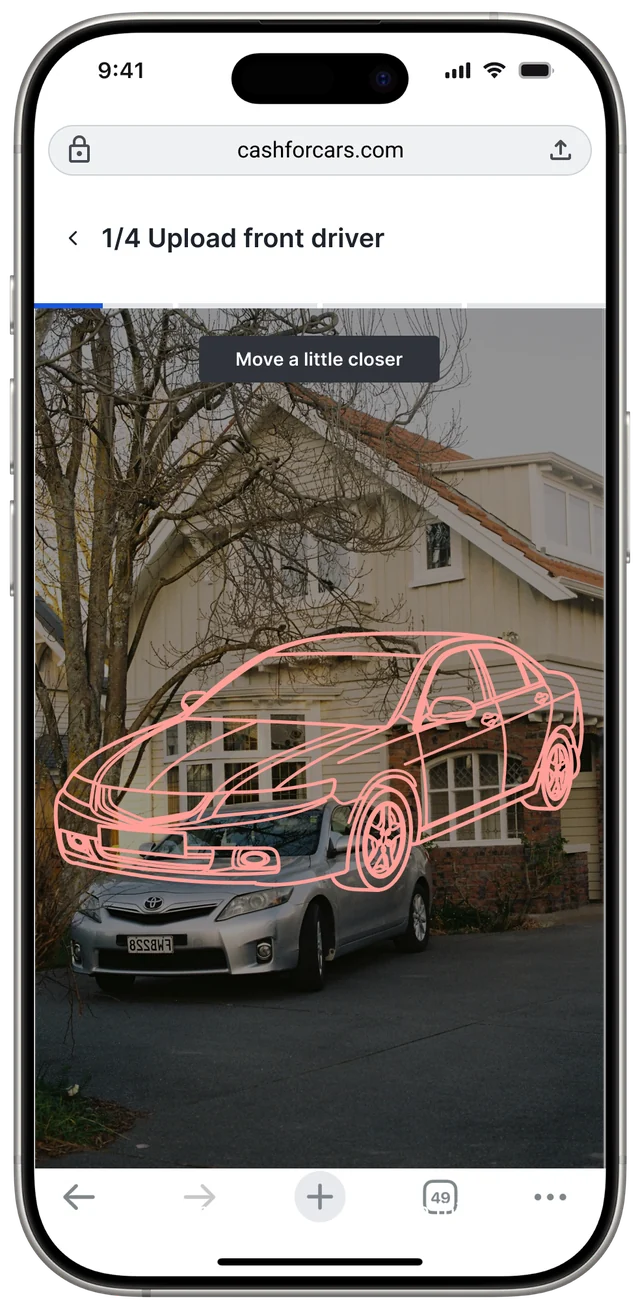
The capture screen uses a car outline, plain instructions and red, yellow and green feedback to prevent rejected photos. It accepts live photos only, a choice that met some pushback. Live capture guards against edited images and unusable angles, which supported the goal of fewer verification calls.
A car outline and live coaching help sellers frame each of four photos.Prototype: the outline turns from red to yellow to green as the car lines up.
An offer sellers can trust
The final offer page was the most frustrating moment in the journey. The redesign explains the price, sets out what happens next and states the deadline in neutral language.
Tried
Breakdown card
Line items showed too much and were likely to invite more calls.
Tried
Price range
A live range could encourage people to change answers to raise the number.
Chosen
Short explainer
A modal gives enough reasoning to justify the offer and head off support calls.
Smaller fixes
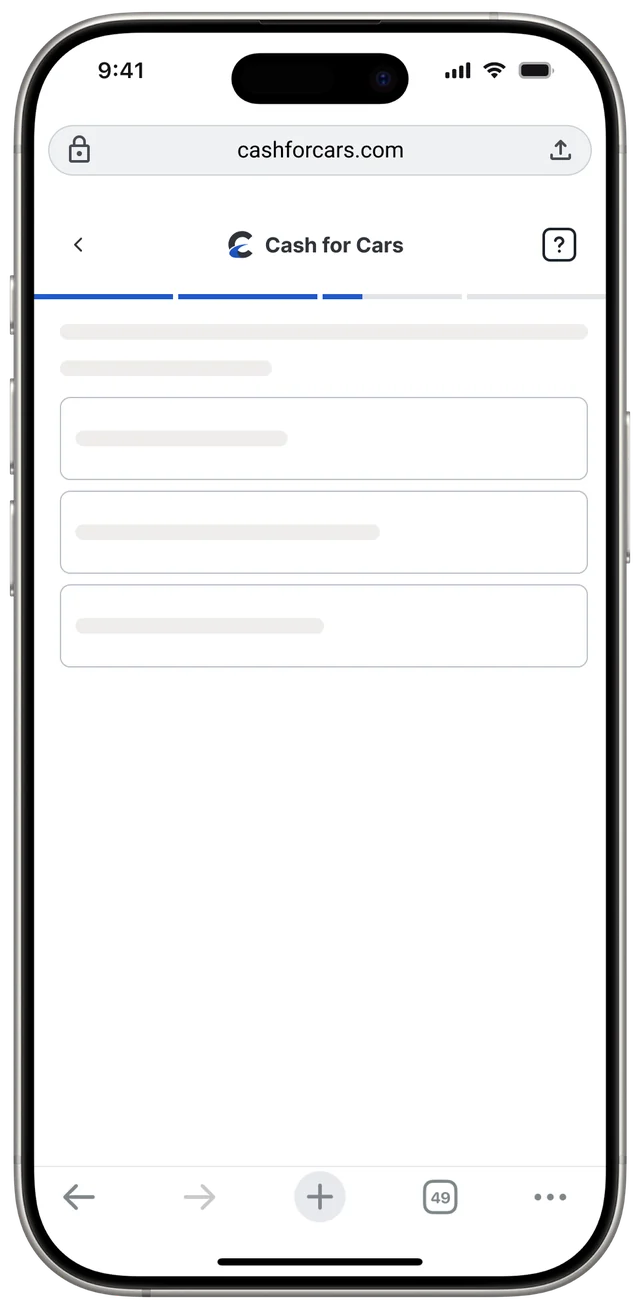
The skeleton screen, with sectioned progress above it.
Sectional progress
Grouping questions into sections gives a clearer sense of progress than a linear bar and feels lighter than one segment per question.
Skeleton screens
63% of people who saw the blank loading screen left, and it was the top source of dead clicks. Skeletons show that work is under way.
One clear exit
The service doesn't accept cars with existing loans, so call requests on that exit screen were wasted effort. It now returns people to the homepage.
Impact
Leadership and product teams received the work well, and most of the designs are in A/B testing.
+16.5%
Pricing model accuracy with image upload, in the PM's early testing
−6%
Rage clicks, tracked in Fullstory, after title and mileage field changes
Removing the dead-end call buttons for ineligible vehicles also cut unnecessary call centre volume, and the loading screen redesign resolved its dead clicks.
Takeaways
Data settled disagreements and kept the project moving. Technical limits will always exist, and good design keeps them out of the seller's way.
A rebuilt place to pay for auction vehicles, made to work for a buyer with one car and a business with a thousand.
Role
Co-lead designer
Team
Two co-lead designers, with Operations, IT, Member Services and Business Intelligence
Timeline
6 months
Buyers
All auction buyers
Unpaid invoices on desktop: balances first, then invoices sorted by due date with overdue ones flagged.
The problem
The average purchase is around $4,000, and questions about paying for it took up a large share of Support's time. As the business entered new markets, buyers also expected more ways to pay.
The redesign moved payments to Braintree and added Apple Pay, Google Pay and PayPal. It had to be mobile first and accessible. With limited data on how each feature was used, the team kept all existing functionality and relied on familiar patterns.
Before: a desktop-only table of 56 invoices that never said when each one was due.
What changed for buyers
BeforeAfter
Getting a deposit back took a phone callOnline refund requests, with available deposits shown clearly
Wire transfers meant finding and hand-filling formsForms prefilled from the invoices a buyer selects
Payment history stopped after one year, too short for an auditA history page for audits and business records
No way to pay on a phoneMobile-first portal with native payments
Delivery and title handling sat outside the portalDelivery purchase and title status inside the portal
Three kinds of buyer
Reviews with Operations, International, IT, Member Services, Email and Business Intelligence exposed gaps in the system. Surveys and earlier interviews showed how differently people prefer to pay.
High-volume buyers
Often use the API and want to finish payment quickly.
Other businesses
Work on desktop and want to see all the details laid out.
Dealers
Use the mobile app and nothing else.
The design
On desktop, balances sit at the top and overdue invoices come first. Invoices group by sale and location, and selecting several updates the total before checkout. On mobile, the same tasks became three focused flows.
One checkout
Shipping, title mailing and payment details can all be set and edited in one flow. Buyers can apply available funds and choose how they receive each title.
Deposits and refunds
Buyers enter the buying power they want and see the deposit it needs. Refund requests and deposit history sit on the same screen, without calling Support.
Long lists on mobile
Each invoice row expands in place to show vehicle details and actions, so accounts with dozens of invoices stay easy to scan.
Results
−30%
Late payments
Paid online, before40.25%
Paid online, after60%
The old portal never told buyers when payment was due. Putting the due date first, accepting more payment methods and adding native payments in the app all contributed to the drop. Phone calls about payments also fell substantially, and more online payments eased the load on yard workers.
A sign-in page that only pointed elsewhere became the place where members bid, pay and clear what's blocking them.
Role
Lead designer
Team
A senior product designer, with Product, Engineering, Marketing, Sales and Ops
Timeline
5 months
Members
750,000+ in 190+ countries
The problem
Dealers, dismantlers and exporters rely on the platform to manage bids, payments, licenses and inventory, often with seconds to act. The old dashboard mostly sent them to other pages. It didn't show what was urgent or let anyone act on it, so many members skipped it, tracked work by hand and called Support. Tasks that should have been self-service produced more than 45,000 tickets a year.
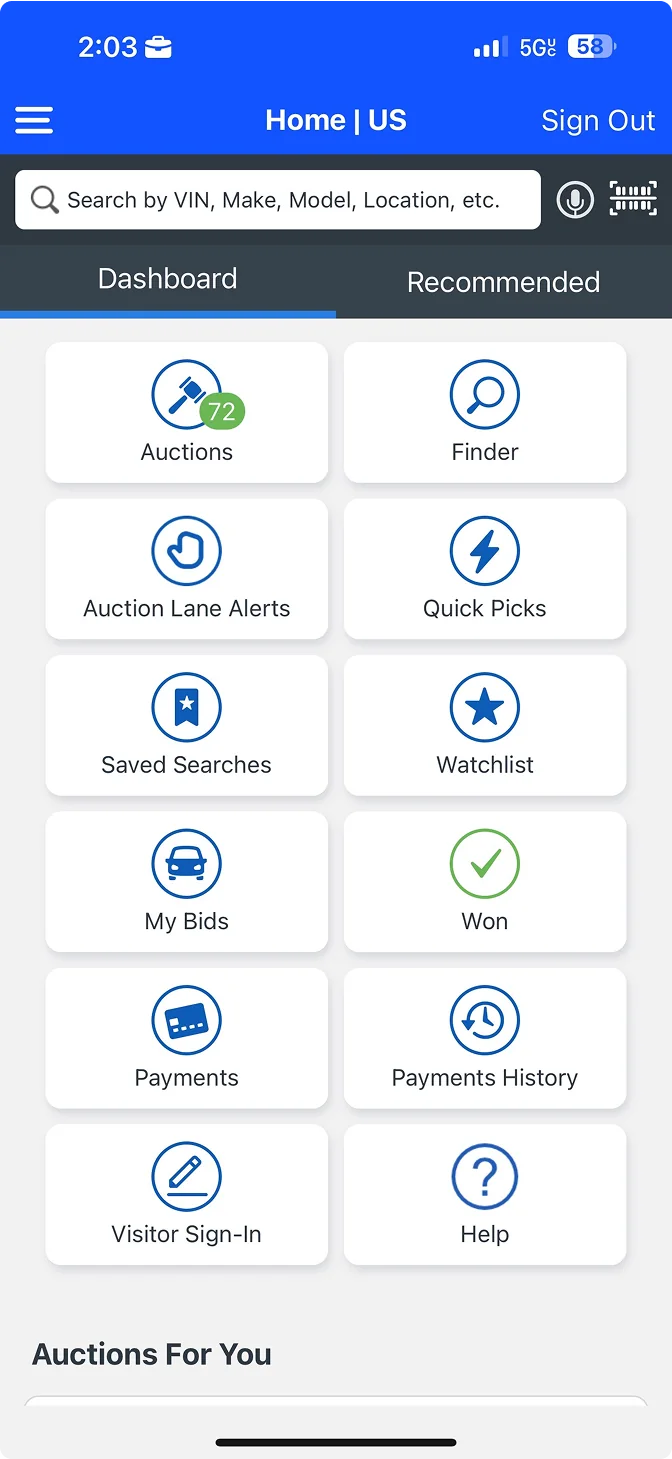
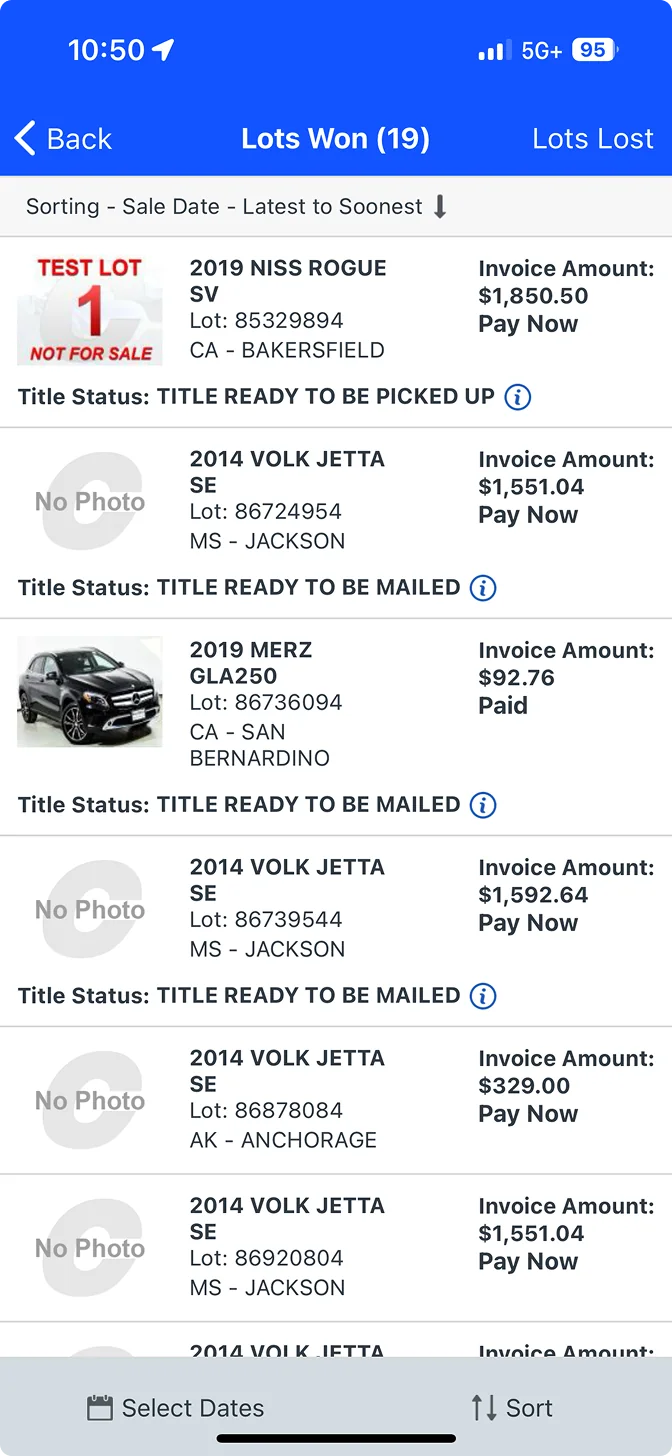
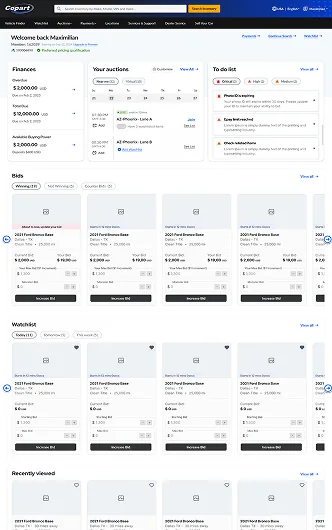
Before: the app's dashboard was a grid of links.Lists like Lots Won showed status but left the next step to the member.
What members needed to know
Research covered more than 25 interviews and over 500 support tickets, alongside heatmaps, behavior tracking and usability tests under real auction pressure. Four needs came up again and again.
Where each vehicle stands
Auction, title delivery or pickup status wasn't easy to find.
The next task
High-volume members were juggling payments and logistics against deadlines.
What blocks bidding
Missing documents or unpaid fees surfaced at the worst possible moment.
What matters today
Alerts competed for attention with no order of urgency.
Finding the layout
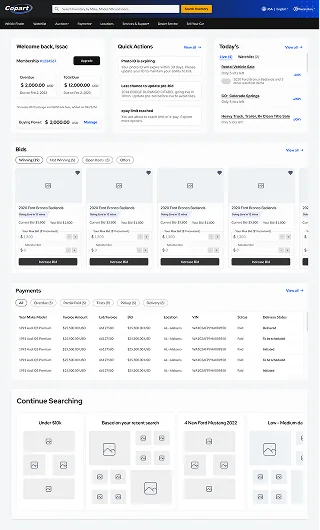
The team first stripped the old dashboard to its essentials to test hierarchy and where inline tasks should sit. Three rounds followed, designed around the power buyer.
The legacy desktop dashboard. Pink marks the banners and widgets removed for the decluttered baseline.
Round 1
Essentials
A clear, modular top section, but too passive for buyers whose revenue depends on it.
Round 2
Grouped flows
Bids and payments scanned better, but the long scroll slowed high-volume buyers.
Round 3
Adaptive workspace
Calendar, watchlist, tasks and finances came together, then density was tuned.
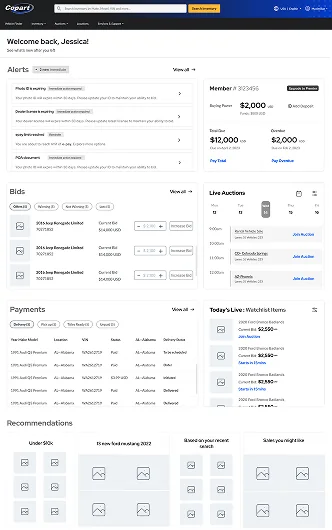
The dashboard
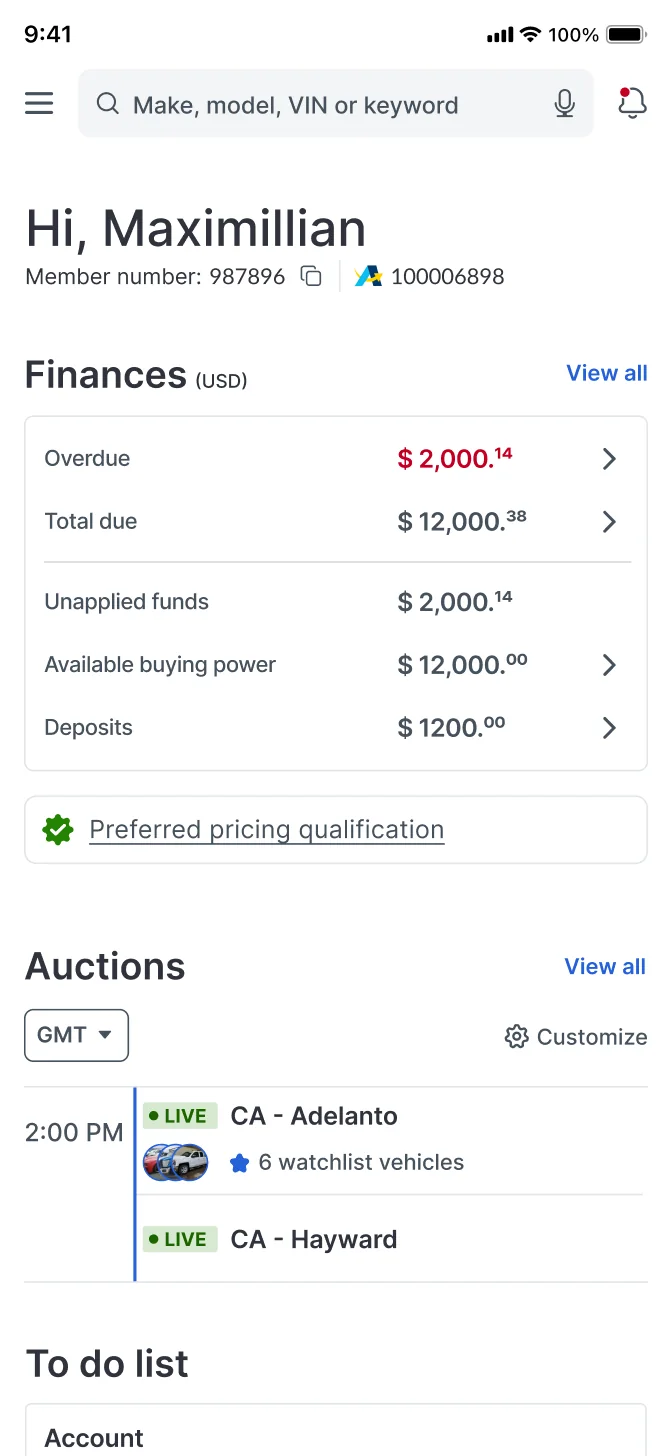
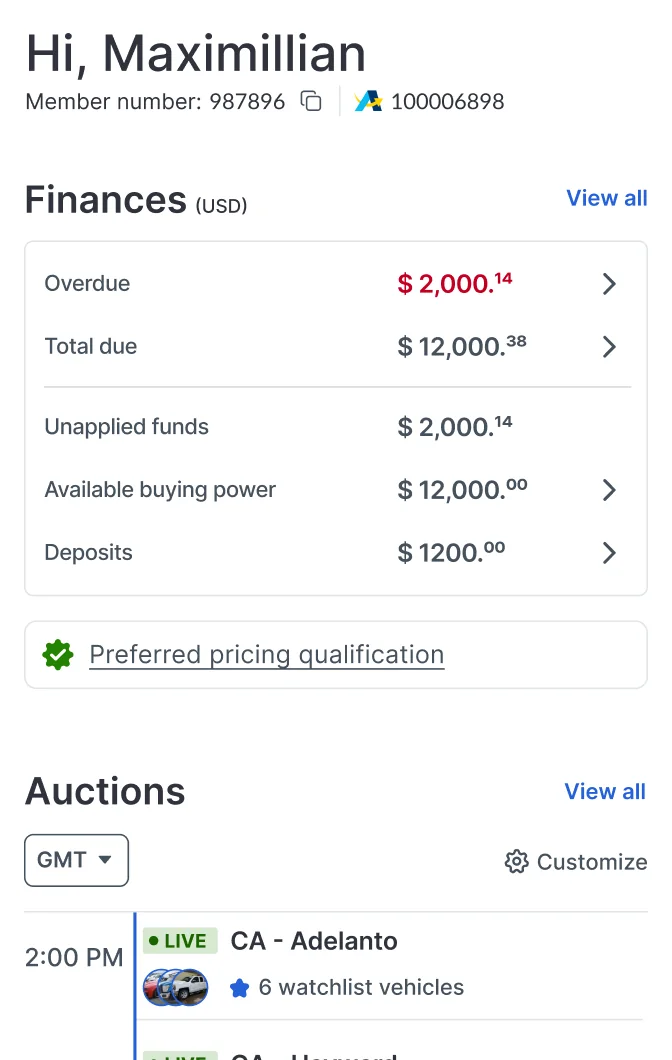
Members now see account status and blockers first, along with buying power, amounts due and auctions in local time. A live to-do list ranks urgent tasks and lets people finish them in place, which cut missed actions by 22%.
After a purchase, vehicles fall into three groups with deadlines and inline actions: ready to pay, ready to schedule and needing title work.
Make a payment, Schedule delivery and Get titles tabs, with overdue amounts flagged and Pay on every row.
Watchlist, recently viewed and alerts
Vehicle cards carry the countdown, the member's bid status and the right next action, so buyers can bid without opening each lot. Lower-priority updates moved to a notification center.
Watchlist cards change with the lot: an offer awaiting the seller, a first bid, a raise, or a Purple Wave listing.Recently viewed vehicles bring buyers back to a lot without restarting a search.The notification center, filtered by account, payments, delivery and titles.
Rebuilding the bidding module
One card per bid state, each with its own next step.
BeforeAfter
Offers were easy to miss and relied on emailOffers and counteroffers in one place with countdowns and inline replies
Buyers didn't realize they were being outbidPrompts to raise a bid while there's still time
Winning led to a call to the yardDelivery and title options right next to the win
A lost bid came with no explanationAn approximate margin that protects pricing
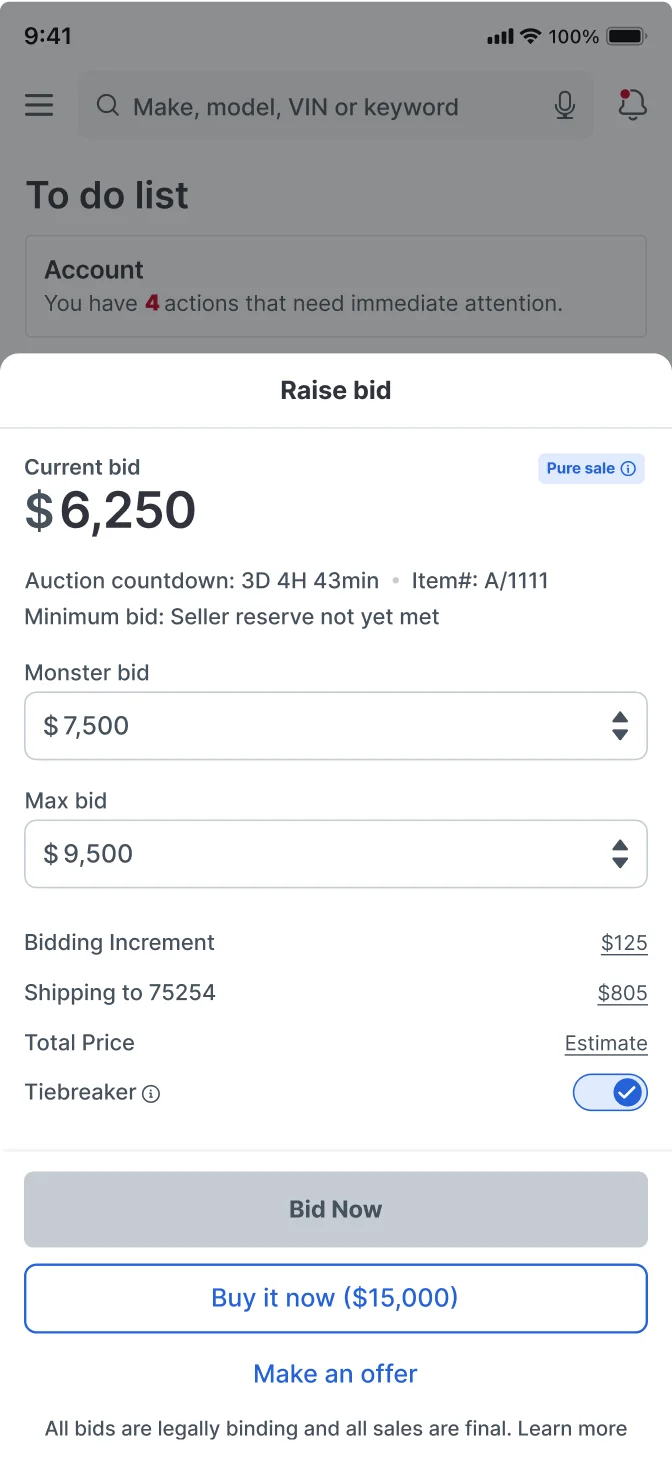
Plus and minus buttons made buyers work out incrementsA scrolling input that offers valid increments
The bid field lists only valid amounts, so buyers scroll to a number instead of calculating it.On mobile, raising a bid happens in one sheet without leaving the dashboard.
Results
+32.3%
Page engagement across payments, bids and registrations
+30.5%
Counterbids
+52.9%
Adoption of auction location customization
45k+
Payments completed on the dashboard
40k+
Upgrades and registrations completed on the dashboard
300k+
Similar vehicle clicks, 23% converting to pre-bids
Tracked actions have kept growing 2 to 5% a month since launch. Shipping cost lookup went from six steps to two, and order placement from two to one. Routine questions moved to self-service, lowering support costs.

 Exploration 1
 Exploration 2
 Chosen